Detects peaks (modes) in a numeric dataset x using kernel density estimation.
For each mode, it determines the range along the X-axis where the density decreases
toward the adjacent minima. The function can also plot the density and the detected modes.
Arguments
- x
Numeric vector. The data for which modes will be calculated.
- bw
Numeric. Bandwidth for the density estimation. Default is
bw = 2.- Q1
Numeric between 0 and 1. Percentile of the density used to filter the most relevant peaks. Default is
Q1 = 0.95.- plot
Logical. If
TRUE, generates a plot of the density with detected modes. Default isTRUE.
Value
A matrix with one row per detected mode and two columns (min and max)
representing the X-axis range of each mode.
Examples
set.seed(123) # Seed
x <- c(
rnorm(200, mean = 2, sd = 0.3),
rnorm(5, mean = 3.5, sd = 0.1),
rnorm(200, mean = 5, sd = 0.3)
)
# Compute and plot modes
modes <- findModes(x, bw = 0.2, Q1 = 0.5, plot = TRUE)
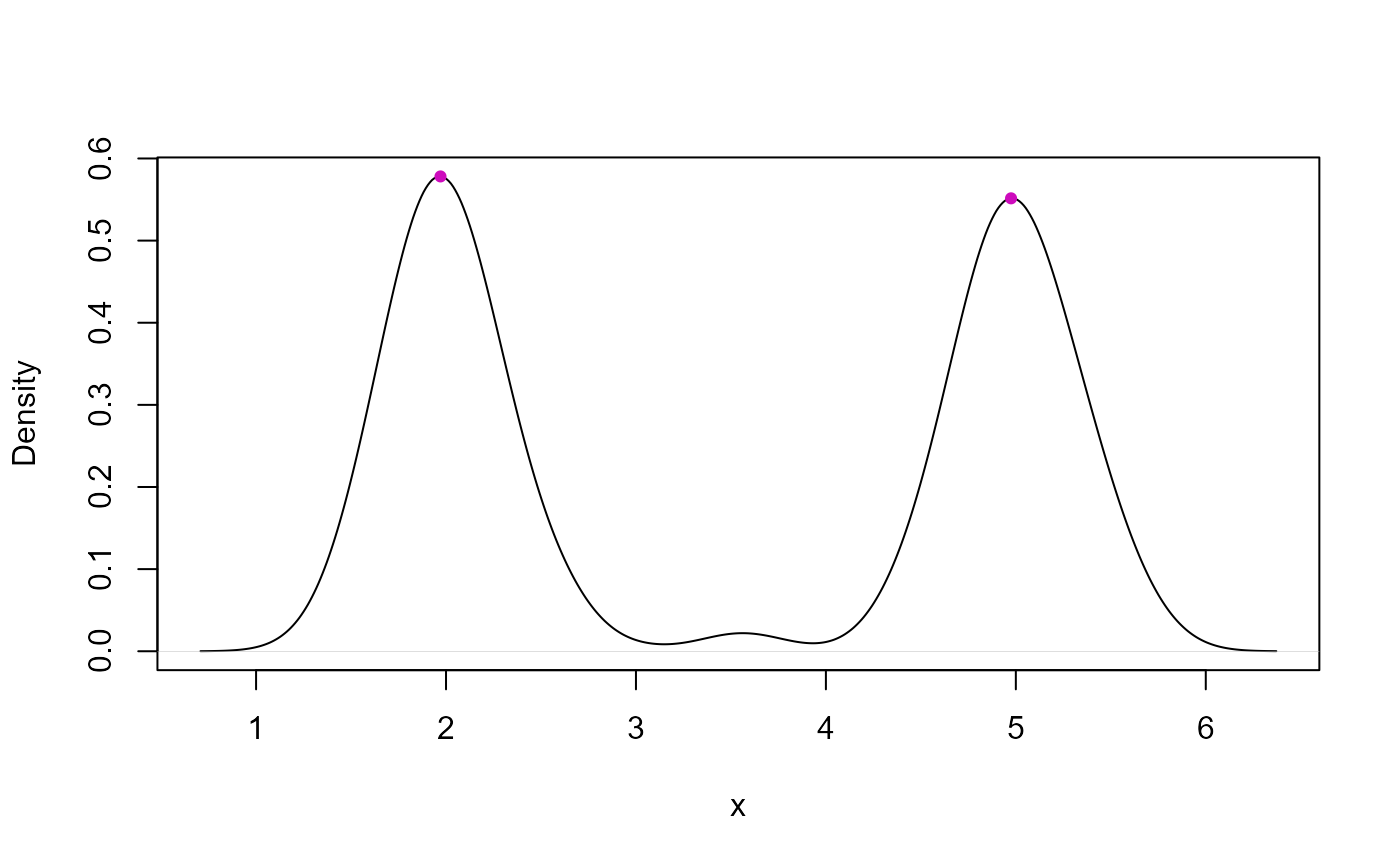 # X-axis ranges for each mode
modes
#> min max
#> mode1 0.7072493 3.156928
#> mode2 3.9328437 6.371437
# X-axis ranges for each mode
modes
#> min max
#> mode1 0.7072493 3.156928
#> mode2 3.9328437 6.371437